What We Did
We chose a type of homeostasis in the body to design an experiment around to test that functions homeostasis. Our group decided on testing blood pressure. To do this we tested to see the effect of temperature on blood pressure. The test subjects put their hands in various temperatures of water from 30F* to 110F*.
Introduction to Lab
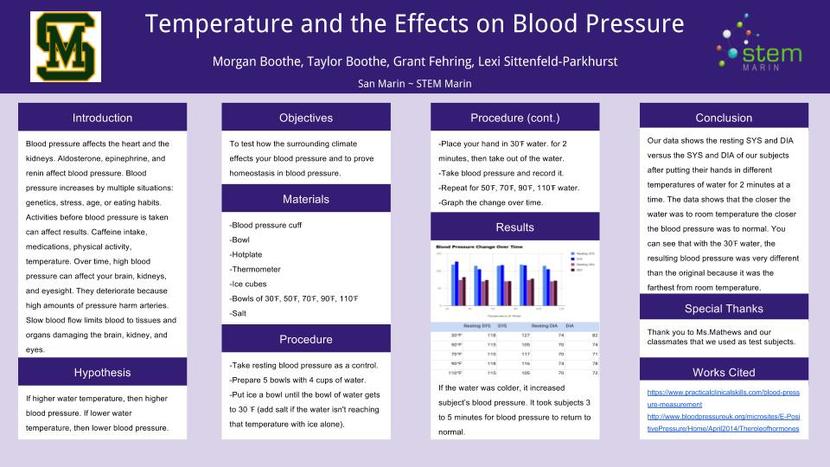
Blood pressure affects the heart and the kidneys. Depending on the cause, different hormones are in effect, but some of them are aldosterone, epinephrine (adrenaline), and renin. Blood pressure can be increased by a number of things whether it be genetics, stress, age, or eating habits. However, some people do not know that activities you do before you get your blood pressure taken can affect the results. For example, caffeine intake, medications, physical activity, and what we’re observing, temperature. Over time, high blood pressure can affect your brain, kidneys, and eyesight in a negative way. They can deteriorate because the high amount of pressure can harm your arteries, which could slow blood flow. A slow blood flow limits the amount of blood tissues and organs get, sometimes damaging the brain, kidney, and eye. We are performing a lab to see how different temperatures affect your blood pressure. We hypothesized that the warmer the water temperature, then the higher your blood pressure.
Materials
1. Blood pressure cuff
2. Bowl
3. Hotplate
4. Thermometer
5. Ice cube
6. Bowls of 30℉, 50℉, 70℉, 90℉, 110℉
7. Salt
2. Bowl
3. Hotplate
4. Thermometer
5. Ice cube
6. Bowls of 30℉, 50℉, 70℉, 90℉, 110℉
7. Salt
Procedure
1. Take your resting blood pressure as a control for each test.
2. Prepare 5 bowls that each have 4 cups of water, or enough to fully submerge your hand in the water.
3. Put ice a bowl until the bowl of water gets to 30 ℉ (add salt if the water isn't reaching that temperature with ice alone)
4. Place your hand in 30℉ water. for 2 minutes, then take out of the water.
5. Take blood pressure and record it.
6. Repeat for 50℉, 70℉, 90℉, 110℉ water.
7. Graph the change overtime.
Results
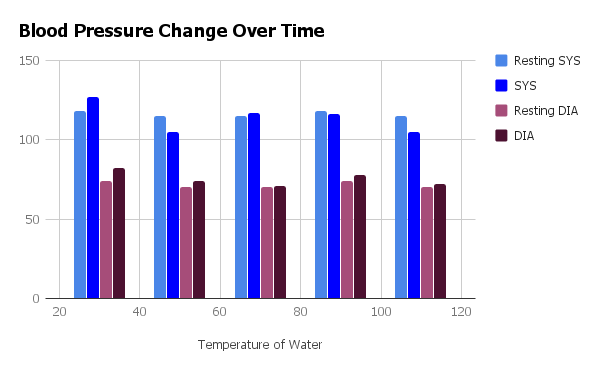
SYS=systolic, this is the top number when you look at blood pressure. It represents the amount of pressure in your arteries during the contraction of your heart muscle.
DIA= diastolic bottom number of the blood pressure reading. It shows the amount of pressure in the arteries in between the heart’s beats. This is when the heart fills with blood to get oxygen.
We observed that it was a challenge to work with the blood pressure cuff since none of used had used one before. We also noticed that it was more uncomfortable to keep your hand in the colder water, and the warmer water was comfortable.
Discussion
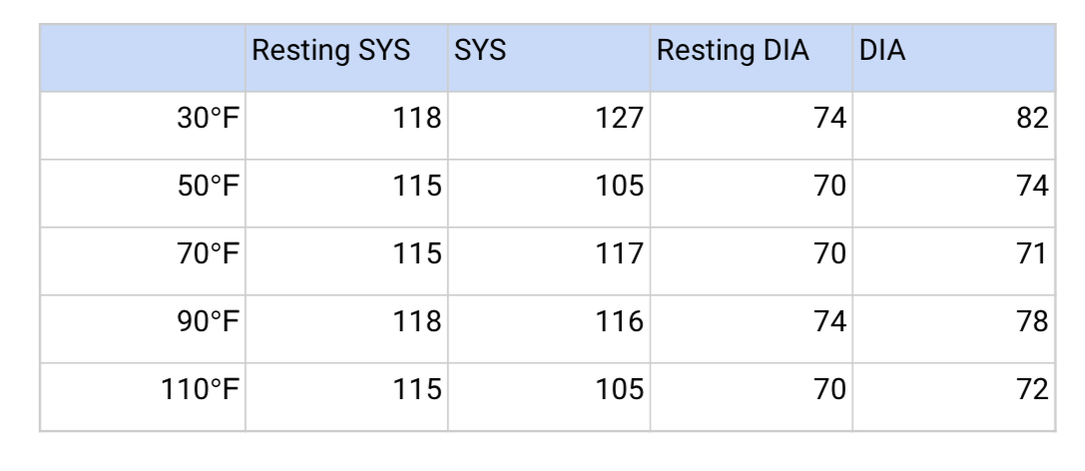
Our data shows the resting systolic and diastolic versus the systolic and diastolic of our subjects after putting their hands in different temperatures of water for 2 minutes at a time. The data shows that the closer the water was to room temperature the closer the blood pressure was to normal. You can see that with the 30℉ water, the resulting blood pressure was very different than the original because it was the farthest from room temperature.
One thing that went very well in this experiment was the choosing of the water temperatures. We were able to get a variety of different temperatures without harming our subjects.
One error that happened in our lab was not fully understanding how to use the blood pressure machine. Since we did not know how to correctly use it, the first few blood pressure readings were completely inaccurate. Another error we had was not running the same test on every subject or having each subject do every test.
Next time we can improve the lab by testing each temperature more than once so we can get an accurate array of the data. We can also take the subjects blood pressure after a certain interval to get a better idea of homeostasis.
One question that has stemmed from this lab is what other functions that have homeostasis in our body are affected by temperature.
Scientific Poster
Work Cited
https://www.practicalclinicalskills.com/blood-pressure-measurement
http://www.bloodpressureuk.org/microsites/E-PositivePressure/Home/April2014/Theroleofhormones
https://www.webmd.com/hypertension-high-blood-pressure/high-blood-pressure-effects-on-body#1
http://www.bloodpressureuk.org/microsites/E-PositivePressure/Home/April2014/Theroleofhormones
https://www.webmd.com/hypertension-high-blood-pressure/high-blood-pressure-effects-on-body#1
Contents
- Homeostasis- that is when the function goes above or below normal depending on what is happening to the body or organ, and then after time the body goes back to normal, which is the level the function when the body is at rest.
- Blood pressure- that is the amount of force the blood being pumped has on the arterial walls. A normal number is about 120/80.
- SYS=systolic, this is the top number when you look at blood pressure. It represents the amount of pressure in your arteries during the contraction of your heart muscle.
- DIA= diastolic bottom number of the blood pressure reading. It shows the amount of pressure in the arteries in between the heart’s beats. This is when the heart fills with blood to get oxygen.
Reflection
In this project I learned how to take blood pressure and what blood pressure actually means. Also I learned what you have to put into a scientific poster and how to make one. One down fall our group had was poor time management. We didn't realize how long it would take to either heat or cool the water, leaving us with little time to work on the rest of the project. Also my group and I could have thought through our procedure more and better estimate how long each step would take so we would not e cramming at the end of the period. The biggest take away I had from the project was homeostasis because I never knew what it was and how often it occurs. One thing I would change in this project is having more time to do it, so we could get more data and a larger spread of data.
