What We Did
For this project we used an app called Physics Toolbox Accelerometer. We used this app to record how we walk in all three dimensions. Most groups taped the phone to a subject's back, but since my group wanted to focus just on leg movement, we taped the phone to the upper thigh. We used the data we collected to estimate someone's height. To do this we found the average step distance of our subjects and put it into an equation we found to estimate their height. Our hypothesis is that some one who takes smaller steps will be shorter.
How We Ran Our Experiment
For this project, we took three students from our group and found their average step distance by counting the number of steps they took in 20 ft, 24 ft, and 30 ft. After, we calculated the coefficient by taking our height and dividing it by the average step distance. We then got six students from our class and asked them to walk the same distance as the other three from our group. Using the data we got, we took it the average step distance and divided it by our coefficient. After getting their estimated height, we compared it to their actual height and saw if our calculations were correct.
Procedure
Part 1: Finding the coefficient
Part 2: Using the accelerometer
Part 3: Finding the subjects height
- Have each person walk 20 feet and count their steps.
- Divide 20 feet by the number of steps taken in that distance to find the length of the person’s stride in feet.
- Repeat the same process with 24 feet and 30 feet.
- Find the average of the three step lengths from the three different distances.
- Divide the average step distance by the height (in feet) of the subject to get a coefficient..
- Repeat on the rest of the group and find average coefficient.
Part 2: Using the accelerometer
- Duct tape phone onto the subjects right leg.
- Have the person walk 20 feet.
- Upload data into spreadsheet and create graphs.
Part 3: Finding the subjects height
- Have a group of people that vary in height walk 20 feet and have them count their steps.
- Follow steps 2-4 listed in part 1.
- Take the average step distance (in feet) and divide it by the coefficient found in part 1 (0.412) to get the estimated height of the subject in feet.
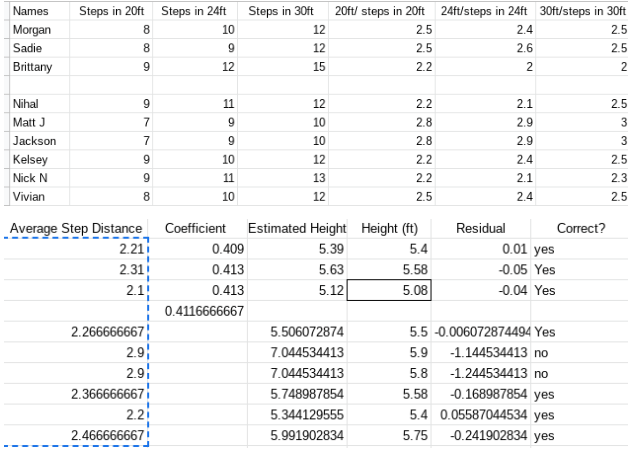
Our Data
Graphs
|
|
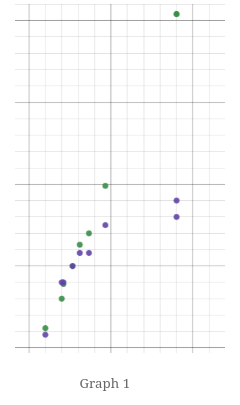
Green plots= average step distance vs predicted height
Purple plots= average step distance vs actual height
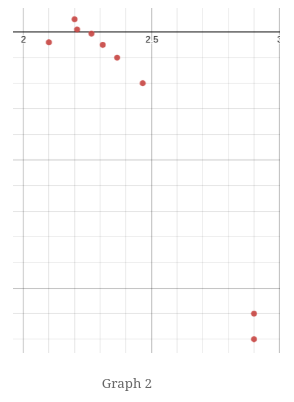
Red plots= residual plot of actual height-predicted
Purple plots= average step distance vs actual height
Red plots= residual plot of actual height-predicted
|
|
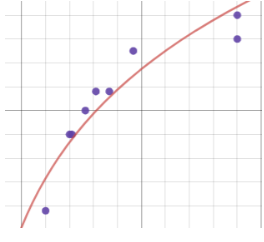
Red line= regression line
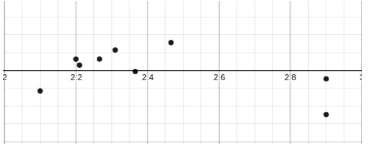
Black plots = residuals
Black plots = residuals
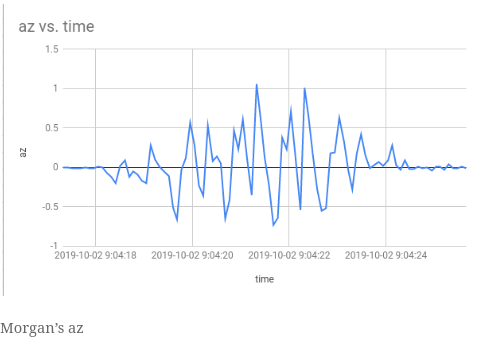
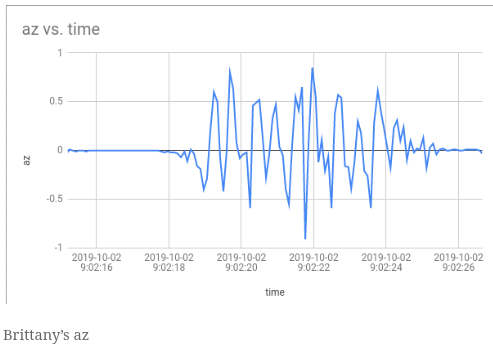
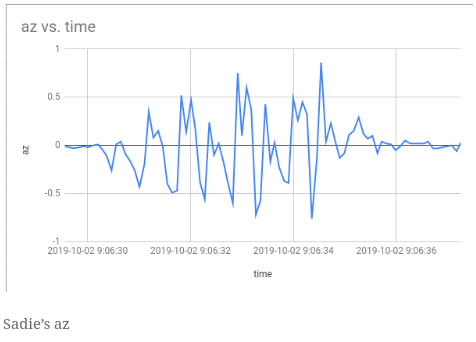
Analysis of Graphs
All the az graphs show how many steps were taken by each person. To find the steps, we counted the number of cycles on the graph. On graph one, you can see that the predicted height represented by the green dots are very linear, while the actual height represented by the purple dots are nonlinear. This means that the linear equation we used was not the most accurate because someone who has a stride of 3 feet is unlikely to be 7 feet tall, as most people are not that tall. This can also been seen in the residual plot because the data follows a pattern, meaning a linear model is not the best. However, when we transform the data, the percent of error decreases a lot, meaning a root 10 graph best fits the data. This is why we had a large outlier when we predicted that people who had an average step distance of 2.9 to be 7 feet tall, but when using the new transformation, the predicted height is 5.93 feet, which is fairly close to the actual height. The reason why the people who were around 5’5” had accurate guesses was because that small segment of the graph could appear linear. The new equation we came up with for the regression line is y=10√(-8.8*107 + 4.9*107x). Your x value is the average step distance and you can plug that value in and find the estimated height.
Reflection
In this project I was able to use the statistics I was learning in math for this project. That was very helpful to me because I was able to reinforce what I was learning in another class and apply that knowledge to a real situation. In this project I was also able to learn more about data analysis and how to work with google sheets which later helped me with a project I did in my statistics class.
One thing I found challenging in this project was figuring out how to use the app. The data recorded from the app was very confusing to analyze because we did not know what each dimension was referring to, so we had a hard time figuring out what our data meant. Another challenge we faced was that we were missing a group member because they were working on the plane project. That meant that we had to do more to make sure the project got done on time. This also led to poor time management because we weren't used to being down a member.
One thing I found challenging in this project was figuring out how to use the app. The data recorded from the app was very confusing to analyze because we did not know what each dimension was referring to, so we had a hard time figuring out what our data meant. Another challenge we faced was that we were missing a group member because they were working on the plane project. That meant that we had to do more to make sure the project got done on time. This also led to poor time management because we weren't used to being down a member.
